bluecoller
New Member
- Joined
- Dec 7, 2010
- Messages
- 2
Two recessions during the Bush years started about the same time,
one in Jan. of 2001 and the second in Feb. of 2008.
Lets compare the two recovery's by job creation During the recovery!
John Maynard Keynes is one of my Idols, so it pisses me off that the
economy is not growing faster. But, there are reasons.
(1) 8,874,000 private sector jobs were lost during the bush recession.
(2) Under Bush the Manufacturing sector lost five million 650 thousand jobs.
(3) During the Bush recession the middle class lost 40% of it,s wealth.
(4) Housing has never ever taken a dive like this.
http://www.census.gov/const/startsan.pdf
In 1959 there were 1,517.0 New Privately Owned Housing Units Started.
Between then and the supply side Housing Collapse in 2008, the lowest
number of Housing Units Started was 1,062.2 thousand during brain-dead
Reagan's recession in 1982.
In 1983 housing starts recovered to 1,703.0 thousand Units.
Home building didn't even slow down during the 2001 recession.
2000 1,568.7
2001 1,602.7
2002 1,704.9
2003 1,847.7
2004 1,955.8
2005 2,068.3
2006 1,800.9
2007 1,355.0
2008 905.5
2009 554.0
2010 586.9
The first 40 months of the two recessions are in these graphs.
http://data.bls.gov/cgi-bin/surveymost?ce
Total Private Employment - CES0500000001
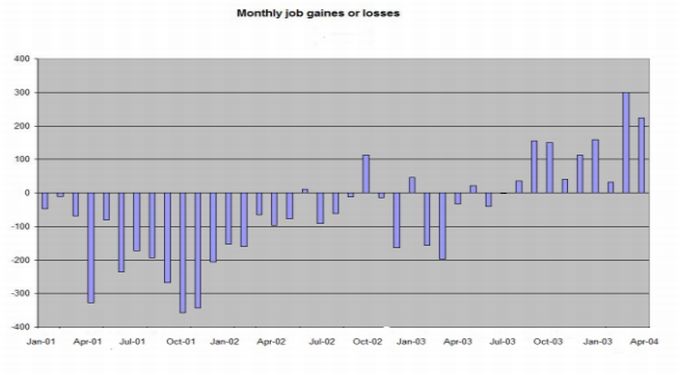
2001...............2008
Private ..........Private
sector-----------sector
1.....-46.....1.....41
2......-8.....2...-136
3.....-67.....3...-112
4....-329.....4...-215
5.....-81.....5...-216
6....-236.....6...-231
7....-173.....7...-259
8....-188.....8...-294
9....-267.....9...-425
10...-364....10...-480
11...-346....11...-797
12...-207....12...-658
13...-151....13...-839
14...-159....14...-725
15....-65....15...-787
16....-96....16...-802
17....-80....17...-312
18.....12....18...-426
19....-95....19...-296
20....-56....20...-219
21....-12....21...-184
22...-108....22...-232
23....-14....23....-42
24...-170....24...-120
25.....57....25....-40
26...-157....26....-27
Month 27 Obama job increases begin
27...-199....27....141
28....-34....28....193
29.....19....29.....84
30....-39....30.....92
31.....-2....31.....92
Month 32 Bush job increases begin
32.....32....32....128
33....161....33....115
34....143....34....196
35.....37....35....134
36....108....36....140
37....170....37....119
38.....32....38....257
39....299....39....261
40....223....40....264
-----1,205 -------2,216
Later months.
----------------------1,205 ----------------------------2,216
May_2004-41 ---310 ---1,515 ------May-2011-41 ---108 ---2,324
Jun_2004-42 -----94 ---1,609 ------Jun-2011-42 ---102 ---2,426
Jul_2004-43 ------41 ---1,650 ------Jul-2011-43 ---175 ---2,601
Aug_2004-44 ---102 ---1,752 ------Aug-2011-44 ----52 ---2,653
Sep_2004-45 ----152 ---1,904 ------Sep-2011-45 ---216 ---2,869
Oct_2004-46 ----327 ---2,231 ------Oct-2011-46 ---139 ---3,008
Nov_2004-47 ----27 ---2,258 ------Nov-2011-47 ---178 ---3,186
Dec_2004-48 ---133 ---2,391 ------Dec-2011-48 ---234 ---3,420
Jan_2005-49 ----95 ---2,486 ------Jan-2012-49 ---277 ---3,697
Feb_2005-50 ----231 ---2,717 ------Feb-2012-50 ---254 ---3,951
Mar_2005-51 ---145 ---2,862 ------Mar-2012-51 ---147 ---4,098
Apr_2005-52 ----346 ---3,208 ------Apr-2012-52 ----85 ---4,183
May_2005-53 ---143 ---3,351 ------May-2012-53 ---116 ---4,299
Jun_2005-54 ----261 ---3,612 ------Jun-2012-54 ----63 ---4,362
Jul_2005-55 -----280 ---3,892 ------Jul-2012-55 ---163 ---4,525
Aug_2005-56 ---187 ---4,079 ------Aug-2012-56 ----97 ---4,622
Sep_2005-57 -----84 ---4,163 ------Sep-2012-56 ---104 ---4,726
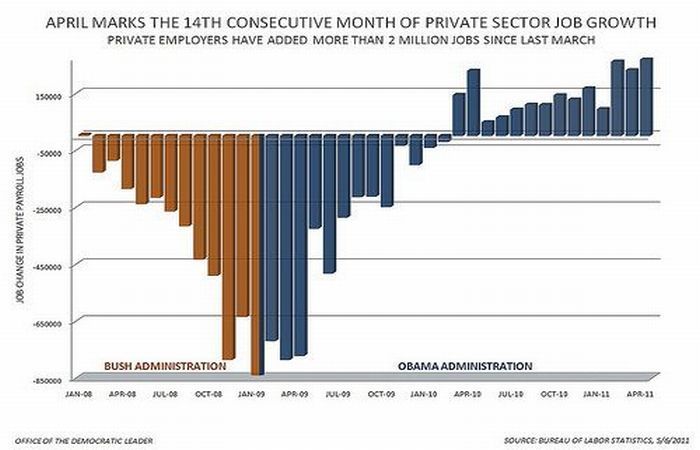
Where the hell are the the supply side jobs during the 8 Bush years?
8 years of the supply side scam, and a loss of 646,000 jobs.
The Bush recovery.
Jul 2003 --108,264
Jan 2008 --115,647
-------------7,383
Obama already has 4,726 jobs added.
The Bush supply side recession lost 8,874,000 private sector jobs then they
say Obama is not getting them back quick enough. Now half of the people want
Mitt and his Mutt to give my country back to the vulture capitalists.
Sh*t. --Azzholes.
For Republicans, Lying is a way of life.


-----Bluecoller, the grumpy old kraut-----
one in Jan. of 2001 and the second in Feb. of 2008.
Lets compare the two recovery's by job creation During the recovery!
January 20, 2012
http://www.realclearpolitics.com/vi..._of_course_the_economy_is_getting_better.html
Romney the Dork (mitt the twit)
"The president's policies have made the recession deeper and have made the recovery
more tepid and more difficult on the American people. This is the worst recovery
that we have seen from a recession since Hoover.
Romney the Dork, Mitt the twit. the lying A-hole claims that he can read a balance sheet?
How often does 500,000 jobs come up on the federal Gov. balance sheet?
Romney
“We should be seeing numbers in the 500,000 jobs created per month,”
Romney said during an interview on Fox News. “This is way, way, way off from
what should happen in a normal recovery.”
John Maynard Keynes is one of my Idols, so it pisses me off that the
economy is not growing faster. But, there are reasons.
(1) 8,874,000 private sector jobs were lost during the bush recession.
(2) Under Bush the Manufacturing sector lost five million 650 thousand jobs.
(3) During the Bush recession the middle class lost 40% of it,s wealth.
(4) Housing has never ever taken a dive like this.
http://www.census.gov/const/startsan.pdf
In 1959 there were 1,517.0 New Privately Owned Housing Units Started.
Between then and the supply side Housing Collapse in 2008, the lowest
number of Housing Units Started was 1,062.2 thousand during brain-dead
Reagan's recession in 1982.
In 1983 housing starts recovered to 1,703.0 thousand Units.
Home building didn't even slow down during the 2001 recession.
2000 1,568.7
2001 1,602.7
2002 1,704.9
2003 1,847.7
2004 1,955.8
2005 2,068.3
2006 1,800.9
2007 1,355.0
2008 905.5
2009 554.0
2010 586.9
The first 40 months of the two recessions are in these graphs.
http://data.bls.gov/cgi-bin/surveymost?ce
Total Private Employment - CES0500000001
2001...............2008
Private ..........Private
sector-----------sector
1.....-46.....1.....41
2......-8.....2...-136
3.....-67.....3...-112
4....-329.....4...-215
5.....-81.....5...-216
6....-236.....6...-231
7....-173.....7...-259
8....-188.....8...-294
9....-267.....9...-425
10...-364....10...-480
11...-346....11...-797
12...-207....12...-658
13...-151....13...-839
14...-159....14...-725
15....-65....15...-787
16....-96....16...-802
17....-80....17...-312
18.....12....18...-426
19....-95....19...-296
20....-56....20...-219
21....-12....21...-184
22...-108....22...-232
23....-14....23....-42
24...-170....24...-120
25.....57....25....-40
26...-157....26....-27
Month 27 Obama job increases begin
27...-199....27....141
28....-34....28....193
29.....19....29.....84
30....-39....30.....92
31.....-2....31.....92
Month 32 Bush job increases begin
32.....32....32....128
33....161....33....115
34....143....34....196
35.....37....35....134
36....108....36....140
37....170....37....119
38.....32....38....257
39....299....39....261
40....223....40....264
-----1,205 -------2,216
Later months.
----------------------1,205 ----------------------------2,216
May_2004-41 ---310 ---1,515 ------May-2011-41 ---108 ---2,324
Jun_2004-42 -----94 ---1,609 ------Jun-2011-42 ---102 ---2,426
Jul_2004-43 ------41 ---1,650 ------Jul-2011-43 ---175 ---2,601
Aug_2004-44 ---102 ---1,752 ------Aug-2011-44 ----52 ---2,653
Sep_2004-45 ----152 ---1,904 ------Sep-2011-45 ---216 ---2,869
Oct_2004-46 ----327 ---2,231 ------Oct-2011-46 ---139 ---3,008
Nov_2004-47 ----27 ---2,258 ------Nov-2011-47 ---178 ---3,186
Dec_2004-48 ---133 ---2,391 ------Dec-2011-48 ---234 ---3,420
Jan_2005-49 ----95 ---2,486 ------Jan-2012-49 ---277 ---3,697
Feb_2005-50 ----231 ---2,717 ------Feb-2012-50 ---254 ---3,951
Mar_2005-51 ---145 ---2,862 ------Mar-2012-51 ---147 ---4,098
Apr_2005-52 ----346 ---3,208 ------Apr-2012-52 ----85 ---4,183
May_2005-53 ---143 ---3,351 ------May-2012-53 ---116 ---4,299
Jun_2005-54 ----261 ---3,612 ------Jun-2012-54 ----63 ---4,362
Jul_2005-55 -----280 ---3,892 ------Jul-2012-55 ---163 ---4,525
Aug_2005-56 ---187 ---4,079 ------Aug-2012-56 ----97 ---4,622
Sep_2005-57 -----84 ---4,163 ------Sep-2012-56 ---104 ---4,726
57 months after the job losses started Keynesian economics is
563 thousand jobs ahead of supply side economics, during the
job recovery period.
From Jan 2001 to Jan 2009, the economy lost 646,000 private sector jobs.
This is a failed policy. Supply side failed. Period.
Jan --2001 ---------111,631
Jan --2009 ---------110 985 ---------Minus 646,000 ---Minus 0.06%
Where the hell are the the supply side jobs during the 8 Bush years?
8 years of the supply side scam, and a loss of 646,000 jobs.
In the 24 months of job losses during the Bush recession the economy lost
almost nine million private sector jobs.
This is a failed policy. Supply side failed. Period.
Jan 2008 --115,647
Feb 2010 --106,773 --minus 8,874,000 private sector jobs.
This is a failed policy. Supply side failed. Period.
From Jan 2001 to Feb 2010, the full length of the supply-side experiment
the Manufacturing sector lost five million 650 thousand jobs.
Jan --2001 ---17,112
Feb --2010 ---11,462 ---Minus 5,650
This is a failed policy. Supply side failed. Period.
The Bush recovery.
Jul 2003 --108,264
Jan 2008 --115,647
-------------7,383
Obama already has 4,726 jobs added.
The Bush supply side recession lost 8,874,000 private sector jobs then they
say Obama is not getting them back quick enough. Now half of the people want
Mitt and his Mutt to give my country back to the vulture capitalists.
Sh*t. --Azzholes.
For Republicans, Lying is a way of life.
-----Bluecoller, the grumpy old kraut-----